
Website Heat Maps: Understanding User Behavior to Boost Conversions
If you’ve ever wondered what your visitors are actually doing on your website — where they click, how far they scroll, and what they completely ignore — website heat maps are the answer. These powerful visual tools transform raw user behavior data into color-coded maps that make it easy to see exactly how people interact with your pages. Whether you’re a business owner, marketer, or web designer, understanding heatmaps can be a game-changer for your online performance.
What Are Website Heat Maps?
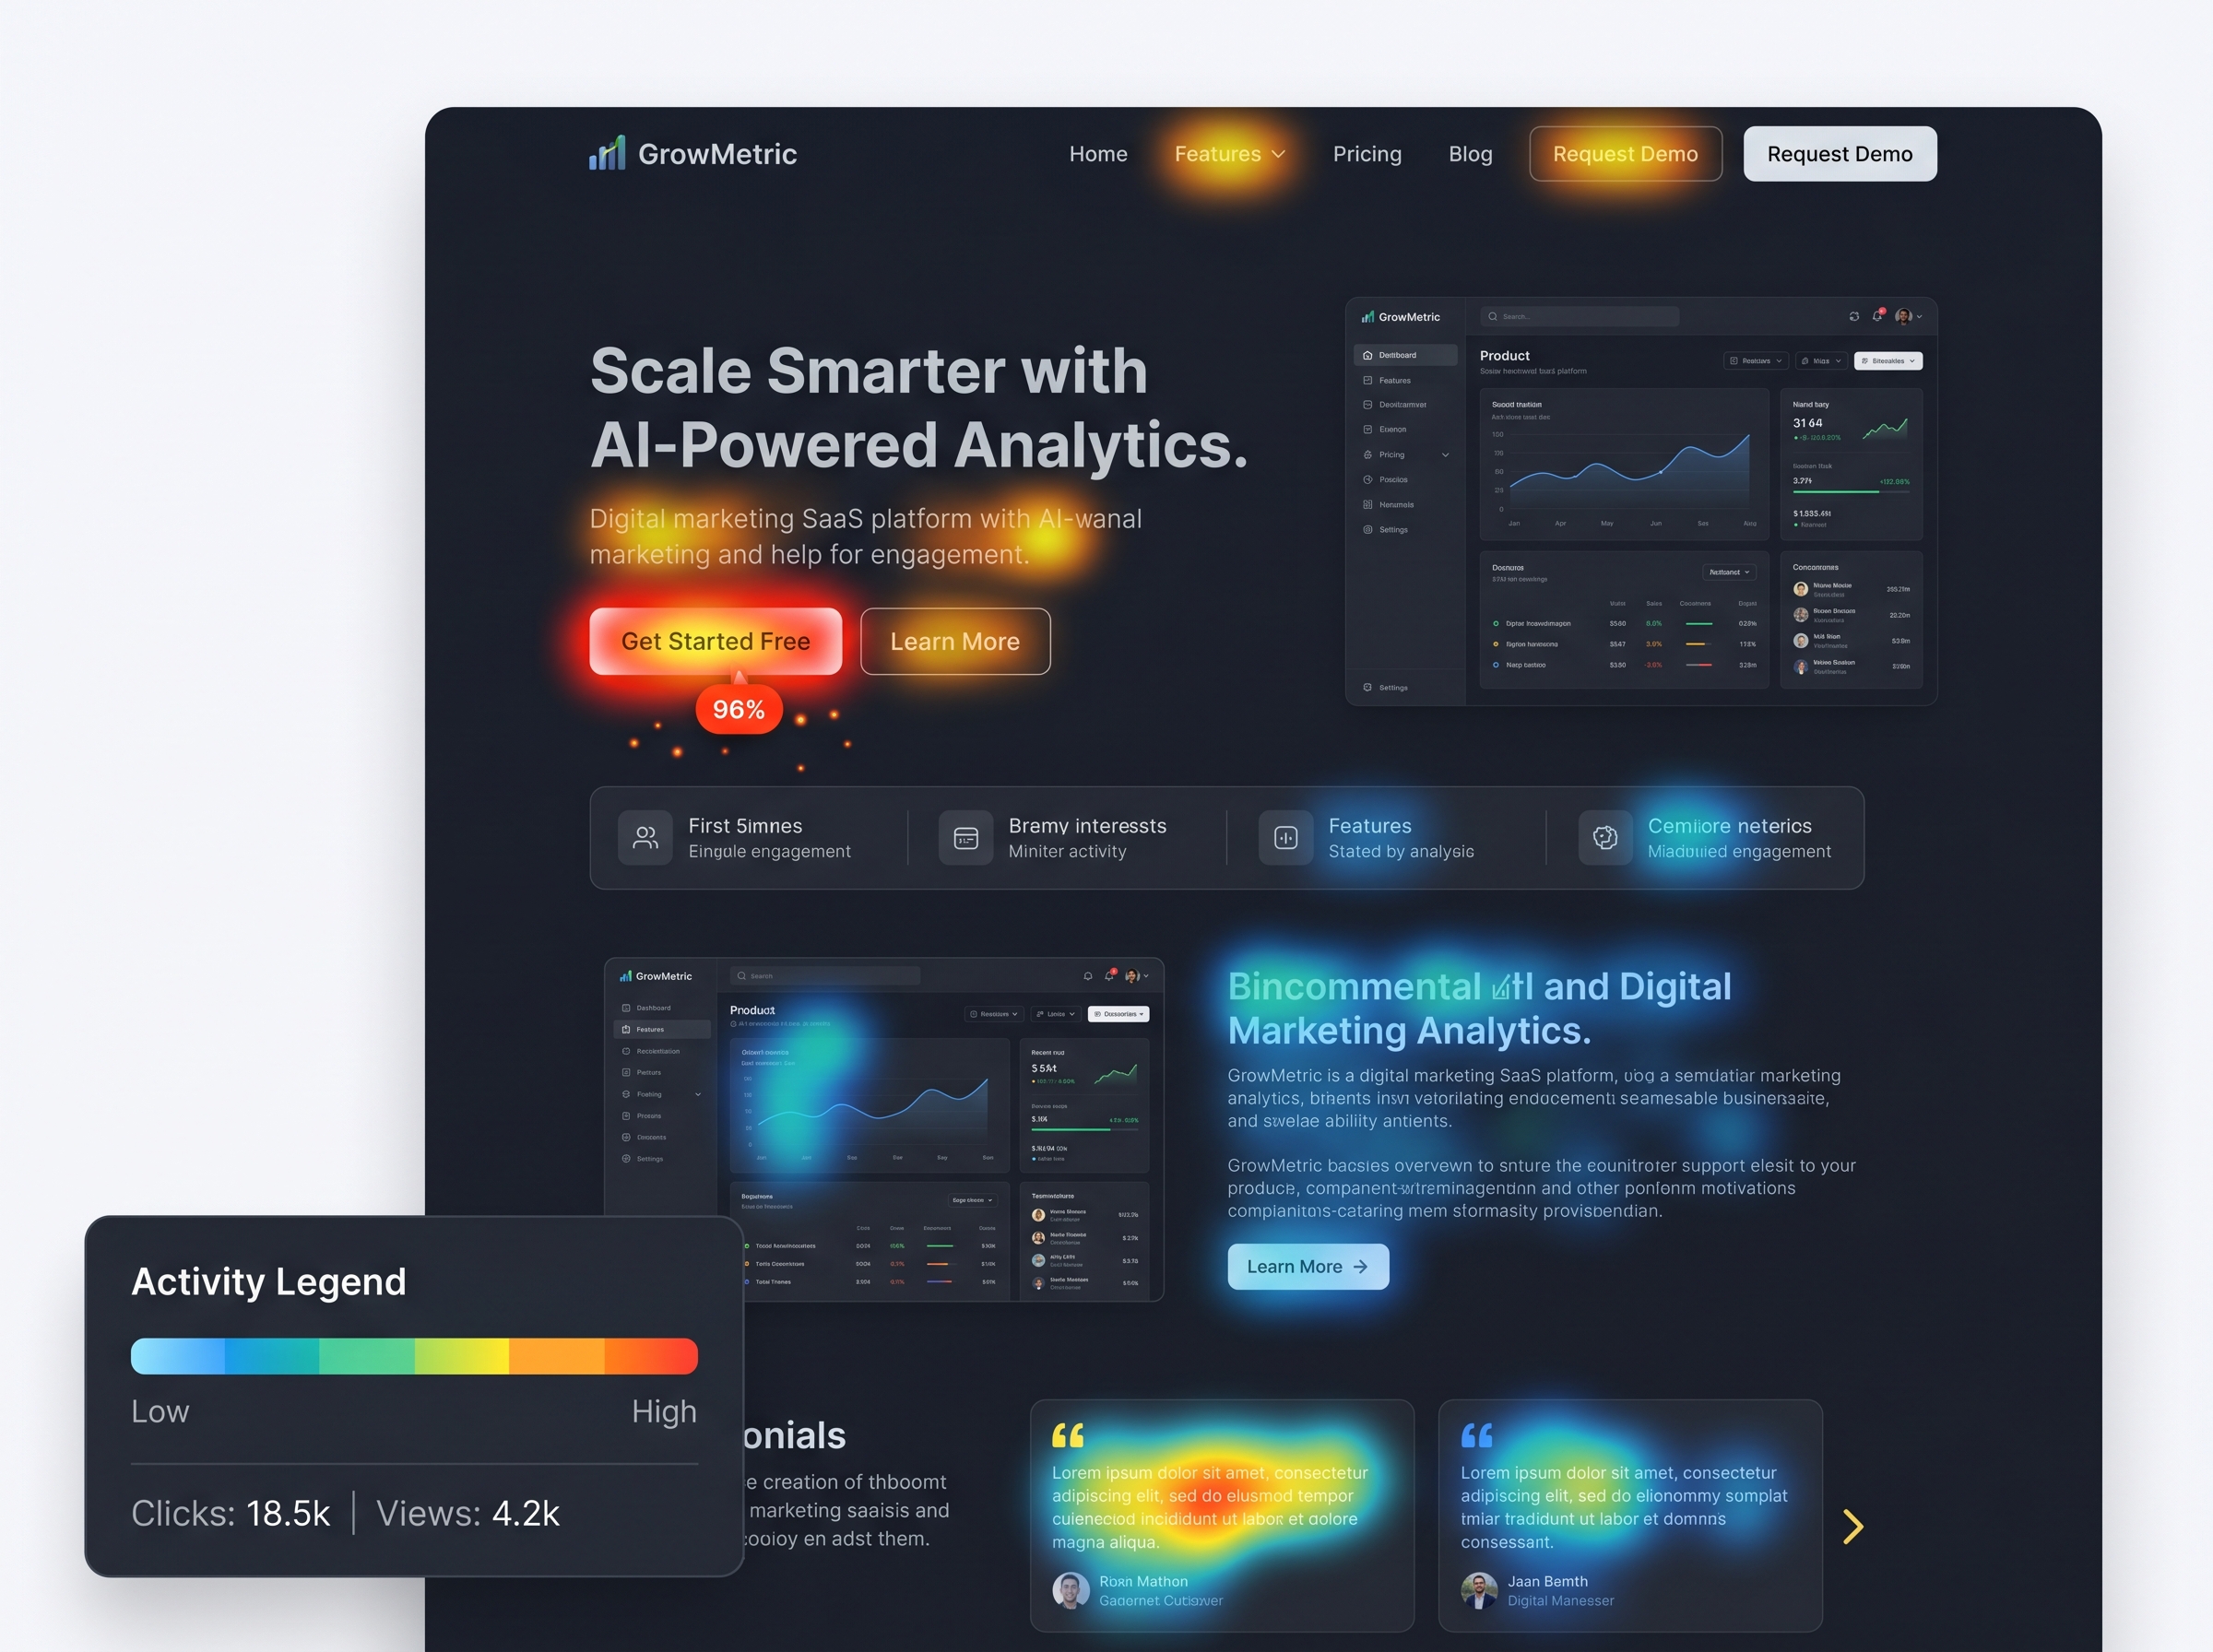
A website heat map is a data visualization tool that uses color gradients — typically ranging from cool blues to hot reds — to represent user activity on a webpage. Areas with the most interaction appear in warm, bright colors, while less-visited areas show cooler tones. This gives you an at-a-glance understanding of where attention is focused and where it’s being lost.
Unlike traditional analytics tools that show you numbers and percentages, heatmaps show you the story behind the data. They answer the “what” and “where” of user behavior, helping you make smarter, evidence-based decisions about your website design and content strategy.
Types of Website Heat Maps You Should Know
Not all heatmaps are created equal. There are several distinct types, each offering a different lens through which to view user behavior:
1. Click Maps
Click maps track exactly where users click on a page — including buttons, links, images, and even areas that aren’t clickable. This is incredibly useful for identifying whether your calls-to-action are being noticed, or if users are clicking on elements that don’t actually do anything (a sign of poor UX).
2. Scroll Maps
Scroll maps show how far down a page visitors typically scroll before leaving. If your most important content or CTA is sitting below the point where most users drop off, you have a serious visibility problem. Scroll maps help you prioritize content placement for maximum impact.
3. Move Maps (Hover Maps)
Move maps track mouse movement across the screen. Research suggests that mouse movement often correlates with eye movement, making hover maps a useful proxy for understanding where users are looking and what’s capturing their attention.
4. Rage Click Maps
Rage clicks occur when a frustrated user repeatedly clicks on the same element — usually because it’s not responding as expected. Identifying rage click hotspots can help you quickly fix broken links, unresponsive buttons, or confusing UI elements.
5. Session Recordings
While not technically a heatmap, session recordings are often bundled with heatmap tools. They allow you to watch real playback of individual user sessions, giving you a granular view of the full user journey on your site.
Why Website Heat Maps Matter for Your Business
Website heat maps bridge the gap between quantitative data (like bounce rates and page views) and qualitative insights (like why users are leaving or not converting). Here’s why they’re essential for any serious digital marketing strategy:
- Improve Conversion Rates: Identify friction points in your sales funnel and fix them before they cost you customers.
- Optimize Page Layouts: Understand which page elements are drawing attention and restructure your layout accordingly.
- Validate A/B Tests: Use heatmap data alongside split testing to understand not just which version performs better, but why.
- Enhance Mobile UX: Many heatmap tools offer separate mobile views, helping you optimize the experience for smartphone users.
- Reduce Bounce Rates: Discover what’s causing visitors to leave quickly and make targeted improvements to keep them engaged longer.
How to Get Started with Heat Map Tools
Getting started with website heat maps is easier than you might think. Several excellent tools are available at various price points, including:
- Hotjar — One of the most popular all-in-one heatmap and session recording platforms, with a free tier available.
- Microsoft Clarity — A completely free tool from Microsoft that offers heatmaps, session recordings, and behavioral insights.
- Crazy Egg — A veteran in the heatmap space with robust A/B testing features built in.
- Lucky Orange — Offers heatmaps, live chat, and conversion funnels in one dashboard.
- FullStory — An enterprise-grade option with deep behavioral analytics capabilities.
Most of these tools require only a small snippet of JavaScript code added to your website — similar to installing Google Analytics. Once set up, data begins collecting automatically, and you can start reviewing heatmaps within hours or days, depending on your traffic volume.
How to Interpret and Act on Heat Map Data
Collecting heatmap data is only half the battle — knowing how to interpret it is where the real value lies. Here are some practical steps to turn insights into action:
Identify Your “Hot Zones”
Look for areas of high engagement and ask yourself: Is this where I want users to focus? If your hottest click zone is a decorative image rather than your CTA button, it’s time to rethink your design hierarchy.
Find the Fold
Use scroll maps to determine where the majority of users stop scrolling. Make sure your most critical messaging — your value proposition, key benefits, and primary call-to-action — appears above this point.
Fix Dead Zones
If large sections of your page are showing up in cool colors with minimal interaction, consider whether that content is truly necessary or if it needs to be repositioned, rewritten, or removed entirely.
Test, Iterate, Repeat
Use your heatmap findings to inform design changes, then re-run your heatmaps after implementing updates. This creates a continuous improvement loop that steadily enhances your website’s performance over time.
Common Mistakes to Avoid
- Drawing conclusions from too little data: Make sure you have a statistically significant sample size before making major changes.
- Ignoring mobile heatmaps: Desktop and mobile user behavior can differ dramatically — always analyze both.
- Focusing only on the homepage: High-traffic landing pages, product pages, and checkout pages often yield the most actionable insights.
- Making changes without a hypothesis: Always have a clear reason for each change so you can measure its impact accurately.
Start Using Website Heat Maps Today
Website heat maps are one of the most powerful — and underutilized — tools in the digital marketer’s toolkit. By visualizing how real users interact with your site, you gain the clarity needed to make smarter design decisions, improve user experience, and ultimately drive more conversions. Whether you’re running an e-commerce store, a service-based business, or a content site, heatmaps provide the behavioral intelligence you need to grow.
Ready to take your website performance to the next level? Start by installing a free heatmap tool like Microsoft Clarity or Hotjar today, and spend just 30 minutes a week reviewing your data. Small, data-driven improvements compound over time — and your conversion rates will thank you.
Want more tips on optimizing your website for better results? Explore our other guides on website design best practices and conversion rate optimization strategies to keep building your digital advantage.